[Editor’s Note: This blog post was originally published on 28 June 2010. The post, in its current form, has been updated as of 8 May 2023 to reflect the final published version of AR6, and again on 17 October 2024 to address new insights on methane.]
This question is not as silly as it may seem. This blog post is the most frequently visited page on our website. It is a topic so fundamental to carbon management that many practitioners are probably afraid to seek clarification out of fear of looking uninformed. Since not everyone working on managing greenhouse gas (GHG) emissions has studied atmospheric chemistry (I admit I have but wouldn’t expect the range of folks working on these issues to have this background), we are updating our primer on the topic.
But first, you should read my previous blog post on greenhouse gases.
I’m going to skip over the underlying physics and chemistry because it is not necessary to engage at that level of scientific technicality to be an intelligent user of GWP values. If you want to dig into the science more, I suggest you refer to the 5th IPCC Assessment Report (AR5) — see Chapter 8 of the Working Group I report for a scientific explanation.
Global Warming Potentials (GWPs) are a quantified measure of the globally averaged relative radiative forcing impacts of particular greenhouse gases in the atmosphere. It is defined as the cumulative radiative forcing – both direct and indirect effects – integrated over time from the emission of a unit mass of gas relative to some reference gas (IPCC 1996). Carbon dioxide (CO2) was chosen by the IPCC as this reference gas and its GWP is set equal to one (1). GWP values allow you to compare the impacts of emissions and emission reductions/removals of different gases.
To be clear, GWP values are applied to units of mass (e.g., kilograms, pounds, metric tons, etc.), not to units of volume (e.g., cubic meters, cubic feet, liters).
Three key factors determine the GWP value of a GHG:
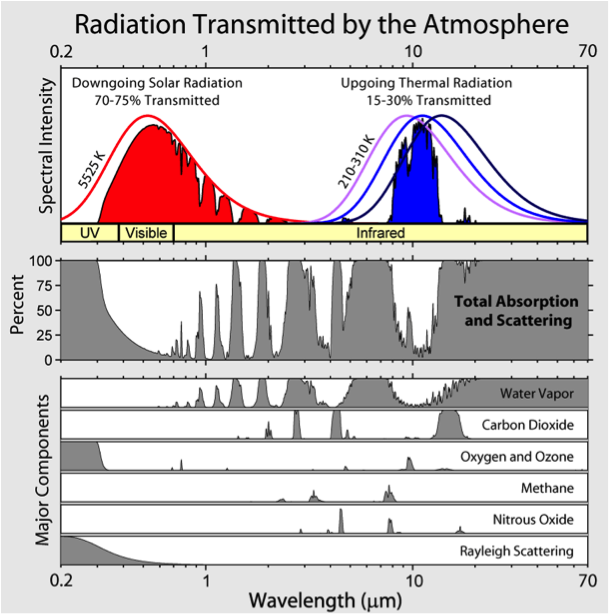
- the ability of the gas to absorb infrared radiation,
- where along the electromagnetic spectrum (i.e., what wavelengths) the gas absorbs radiation, and
- the atmospheric lifetime of the gas.
We typically only use GWP values for gases that have a long atmospheric lifetime (i.e., in years), as only these gases last long enough in the atmosphere to mix evenly and spread throughout the atmosphere to form a relatively uniform concentration. GWP values are meant to be “global,” as the name implies. If a type of gas is short-lived and does not have a global concentration because it is destroyed too quickly to mix evenly throughout the atmosphere, then it typically is not assigned a GWP value.
Specifically, the gases with relatively long atmospheric lifetimes that tend to be evenly distributed throughout the atmosphere, and therefore have global average concentrations, are CO2, CH4, N2O, HFCs, PFCs, SF6, and NF3. (There are numerous other more obscure chemicals you can investigate in the IPCC AR5 report chapter). The short-lived gases such as water vapor, carbon monoxide, tropospheric ozone, other ambient air pollutants (e.g., NOx, and NMVOCs), and tropospheric aerosols (e.g., SO2 products and black carbon) vary spatially. Consequently, it is difficult to quantify their radiative forcing impacts relative to CO2 on a per unit mass basis.
Some GWP values may also account for indirect as well as direct effects. Indirect radiative forcing occurs when chemical transformations involving the original gas produce a type of gas or multiple gases that are also GHGs. Indirect effects can also occur when a gas influences other radiatively important processes, such as the atmospheric lifetimes of other greenhouse gases.
In sum, a higher GWP value means that the gas will absorb more infrared radiation will be absorbed by the gas and more energy will be added to the atmosphere, leading to more warming. Now, there are three more complications to this story.
The first is that gases absorb certain wavelengths of radiation. GHGs each absorb in a given “window” of the radiation spectrum. The more that window is filled, the less there is to absorb. So, as concentrations of certain gases increase they can saturate a wavelength, leaving no more radiation for additional concentrations of gas in the atmosphere to absorb.

The second complication is one that occasionally trips people up. Remember above when we defined GWP by saying “cumulative radiative forcing…integrated over time”? Well, that means that we have to define a time period for the integration to occur. You have to know what the integration period is to make sure you are using the correct GWP. The typical periods that the IPCC has published are 20, 100, and 500 years (in the Fifth Assessment Report (AR5), 500-year values were not published).
Now, to be clear, everyone pretty much universally uses 100 year GWP values, so you will hardly ever see the time period cited. It is just assumed you know that it is 100 years. But occasionally, someone will use something different, not realizing that they are breaking convention. It is increasingly common to see a 20-year methane GWP quoted because it results in a much higher GWP value for that gas. It is also possible to compute an infinite time horizon GWP value, which would account for every bit of radiative forcing of every molecule of gas as long as it existed in the atmosphere (i.e., the gas’s entire atmospheric lifetime).
The last complication relates to the fact that the IPCC keeps updating its GWP values with each of its scientific assessment reports. It makes sense to update GWP values as our scientific understanding improves. However, the problem is that governments, companies, and others are using and making commitments based on GWP values while these revisions are taking place. So, say a company or a country commits to reducing its emissions by 10% and achieves that target. Then suddenly GWP values change and now they no longer make the goal using the new GWP values (due to the mix of different GHGs they emit and reduce). It would be like moving the net after you already kicked the ball towards the goal.
For this reason, the Kyoto Protocol fixed the use of GWP values published by the IPCC in 1996 in its Second Assessment Report. Since then the IPCC has updated its GWP values four times, in 2001, 2007, 2013, and 2021. The result has been a proliferation of GWP values out there that leads to a lot of confusion. To help clarify this confusion, the Conference of the Parties serving as the meeting of the Parties to the Paris Agreement (CMA) has agreed to begin with the AR5 values and update the GWP values used as they are released. Specifically, the language states:
“Each Party shall use the 100-year time-horizon global warming potential (GWP) values from the IPCC Fifth Assessment Report, or 100-year time-horizon GWP values from a subsequent IPCC assessment report as agreed upon by the CMA, to report aggregate emissions and removals of GHGs, expressed in CO2 eq.”
The major reason for the IPCC’s repeated updates to GWP values involves new laboratory or radiative transfer results, improved atmospheric lifetime estimates, and improved calculations of CO2 radiative forcing and CO2 response function. When the absolute radiative forcing of CO2 is updated, then the GWPs of all the other gases relative to CO2 also change. The IPCC has also added numerous new, and rarely used, gases to its list of GWPs.
The result of the varying time periods and the regular updates by the IPCC is a complicated state of affairs. This table presents GWP values for the most common GHGs (there are many more if we listed all the HFCs, PFCs, halogenated alcohols, ethers, and other trace gases). As you can see in this table, each gas has several GWP values that you could choose.
But the truth is, contrary to what a layperson might expect, we typically only use 100-year values, even though some gases have lifetimes of thousands of years.
In the past, we also almost always used the 1996 Second Assessment Report (SAR) values published by the IPCC because they were adopted by the UNFCCC and Kyoto Protocol. However, with the Kyoto Protocol effectively over, the UNFCCC has now adopted the IPCC 2013 AR5 values for international reporting and intends to update to the latest GWP values as they are released in new IPCC Assessment Reports.
So, there is rightly some confusion surrounding what vintage of GWP values should be universally applied so all climate change programs and policies around the world are comparable in their emissions accounting. As new UNFCCC agreements are established there is often pressure to update the GWP values applied, but such changes are complicated when past commitments and agreements were based on earlier GWP values.
I’ve highlighted in red the values currently adopted by the UNFCCC national emissions reporting guidelines. And highlighted in green are the most recent values from the IPCC AR6. I wish I could tell you which one to use. As a default, I would recommend you use the red 2013 values to be consistent with the UNFCCC. But recognize that a future decision under the UNFCCC will adopt the new 2021 AR6 values. Whatever you do, it is essential that you transparently disclose what set of GWP values you apply.
And if you are still using the old 1996 SAR values, it is probably time to update.
| GHG | Lifetime (years) | 20 year GWP | 100 year GWP | 500 year GWP | Report Reference |
|---|---|---|---|---|---|
| Carbon dioxide (CO2) | Complex | 1 1 1 1 1 | 1 1 1 1 1 | 1 NA 1 1 1 | IPCC 2021 – AR6 IPCC 2013 – AR5 IPCC 2007 – AR4 IPCC 2001 – TAR IPCC 1996 – SAR |
| Methane (CH4) Applicable to: fossil – combustion & non fossil* | 11.8 12.4 12 12 12 | 81.2 84 72 62 56 | 27.9 28 25 23 21 | 7.95 NA 7.6 7 6.5 | IPCC 2021 – AR6 IPCC 2013 – AR5 IPCC 2007 – AR4 IPCC 2001 – TAR IPCC 1996 – SAR |
| Methane (CH4) (fossil – fugitive & process)* | 11.8 12.4 | 82.5 85 | 29.8 30 | 10 15 | IPCC 2021 – AR6 IPCC 2013 – AR5 |
| Nitrous oxide (N2O) | 109 121 114 114 120 | 273 264 289 275 280 | 273 265 298 296 310 | 130 NA 153 156 170 | IPCC 2021 – AR6 IPCC 2013 – AR5 IPCC 2007 – AR4 IPCC 2001 – TAR IPCC 1996 – SAR |
| HFC-23 | 228 222 270 260 264 | 12400 10800 12000 9400 9100 | 14600 12400 14800 12000 11700 | 10500 NA 12200 10000 9800 | IPCC 2021 – AR6 IPCC 2013 – AR5 IPCC 2007 – AR4 IPCC 2001 – TAR IPCC 1996 – SAR |
| HFC-134a | 14 13.4 14 13.8 13.8 | 4140 3710 3830 3300 3400 | 1530 1300 1430 1300 1300 | 436 NA 435 400 420 | IPCC 2021 – AR6 IPCC 2013 – AR5 IPCC 2007 – AR4 IPCC 2001 – TAR IPCC 1996 – SAR |
| CF4 (PFC) | 50000 50000 50000 50000 50000 | 5300 4880 5210 3900 4400 | 7380 6630 7390 5700 6500 | 10600 NA 11200 8900 10000 | IPCC 2021 – AR6 IPCC 2013 – AR5 IPCC 2007 – AR4 IPCC 2001 – TAR IPCC 1996 – SAR |
| Sulfur hexafluoride (SF6) | 3200 3200 3200 3200 3200 | 18300 17500 16300 15100 16300 | 25200 23500 22800 22200 23900 | 34100 NA 32600 32400 34900 | IPCC 2021 – AR6 IPCC 2013 – AR5 IPCC 2007 – AR4 IPCC 2001 – TAR IPCC 1996 – SAR |
| Nitrogen trifluoride (NF3) | 569 500 500 740 740 | 13400 12800 12300 7700 NA | 17400 16100 17200 10800 NA | 18200 NA 20700 13100 NA | IPCC 2021 – AR6 IPCC 2013 – AR5 IPCC 2007 – AR4 IPCC 2001 – TAR IPCC 1996 – SAR |
| *Methane from fossil fuels and methane from biogenic sources affect the atmospheric stock of CO2 differently. NA: Not available |
|||||
Row 1: 2021 IPCC AR6 (See Chapter 7 Supplementary Material of Working Group I report)
Row 2: 2013 IPCC AR5 (See Chapter 8 of Working Group I report)
Row 3: 2007 IPCC AR4 (See Chapter 2 of Working Group I report)
Row 4: 2001 IPCC TAR (See Chapter 6 of Working Group I report)
Row 5: 1996 IPCC SAR (See Chapter 2 of the Working Group I report)
You will note that there are two separate sets of GWP values for methane (CH4). The reason is that the fate of CH4 in the atmosphere is to be oxidized to CO2. If this methane originates from fossil fuels, then it results in an addition of CO2 to the atmosphere. In contrast, if the methane originates from a biogenic source, then it just returns CO2 that was previously in the atmosphere. To obtain guidance on which of these two methane GWP values to use for a given emission source category estimation, this post will explain.
To wrap things up for the sake of being thorough, the relationship between the mass of gas and the mass of CO2 equivalents can be expressed as follows:
mass CO2 Eq. = (mass of gas) x (GWP)
Where:
mass CO2 Eq. = mass (e.g., metric tons) of Carbon Dioxide Equivalents
GWP = Global Warming Potential
The calculation is easy. Just multiply the mass of your gas by its GWP value to get CO2 equivalent emissions. Be sure to label the resulting emissions not as CO2, but as “CO2-equivalents” (CO2e or CO2eq). Note, that this is not carbon, but CO2. The ratio of carbon to CO2 is 12/44. So, if you hear someone talking about carbon emissions make sure you have them clarify what they are talking about. Many errors in calculations occur that are simply a failed correction involving a factor of 3.667 (i.e., 44/12).
And in case you were wondering, there are uncertainties in GWP values. The uncertainty ranges of major GHGs are presented in the table below. There is no uncertainty in the GWP value for CO2 because it is 1 by definition.
| GHG | GWP20 | GWP100 | GWP500 |
|---|---|---|---|
| Methane, Fossil and Non-Fossil (CH4) | 32 | 40 | 48 |
| Nitrous oxide (N2O) | 43 | 47 | 49 |
| CFC-11 | 29 | 37 | 42 |
| PFC-14 (CF4) | 26 | 33 | 35 |
| HFC-134a | 28 | 38 | 40 |
| HFC-32 | 31 | 38 | 40 |
Lastly, there is one more confusing issue, which I will only touch on briefly. There are numerous gases like chlorofluorocarbons (CFCs), hydrobromocarbons (e.g., methyl bromide), and halons that deplete stratospheric ozone. These gases are being phased out under the Montreal Protocol and related international agreements. They are also GHGs, although their impact on radiative forcing is even more complex because stratospheric ozone is also a GHG. So, ozone-depleting substances (ODSs) have both positive and negative radiative forcing effects. We generally do not include them in GHG emission inventories because they are being phased out, although some carbon offset projects are crediting the destruction of ODSs.
Comments