I am proud to announce the Institute’s first greenhouse (GHG) gas emissions inventory report . As a leader in education and professional development on GHG management, one of the Institute’s objectives in developing this inventory is to lead by example, publishing an estimate of the GHG emissions related to our operations consistent with the international best practices we teach.
I think you will find our story unique and inspiring. We have successfully created an organization designed to operate with minimal GHG emissions and achieve maximum global impact. We hope our experience will serve as an encouraging example for other organizations, particularly other NGOs focused on climate change.
Jumping straight to the results: in 2009, the total estimated GHG emissions of the Institute were 23.1 metric tons of CO2-e. To put this number in perspective, the average individual living in a U.S. city produces roughly 24.7 metric tons of CO2-e annually. (I think it would be a challenge to find another organization that can claim to emit less than the average U.S citizen.) Or perhaps a better metric is to compare emissions per employee. Using our friends at the World Resources Institute as a benchmark – an organization that has taken commendable efforts to manage their own GHG emissions – per employee our emissions are less than half WRI’s.
How can this be? Is this dodgy accounting? Not to sound smug but we do know a little about emissions accounting. Armed with that background I can unequivocally tell you the answer is no. Further, the story is even more interesting, because the Scope 1 and 2 emissions of the Institute are zero!
How can this be possible, you ask? Well, as we have described before in this blog, the Institute operates as a high-tech virtual organization, which is defined as an organized entity that does not exist in any one, central location, but instead exists and operates through utilization of the internet.
The Institute was designed to serve as an example of the low carbon footprint organization of the future, utilizing modern information technology tools to maximize the global impact of its programs while minimizing its GHG emissions. The 2009 GHGMI staff consisted of four full time employees and five part time contractors working from home offices around the globe. The Institute is also staffed by numerous adjunct faculty members from around the world and does not own or lease any facilities or vehicles. We also operate with an aggressive policy that all non-essential travel, especially air travel, is to be avoided.
Alumni of our training will already have figured out that our emissions must all be Scope 3. We did not want to simply use our virtual organization model as a trick that would allow us to outsource our emissions. So for our inventory, we made every effort to estimate our Scope 3 footprint. This required we include emissions from our prime contractors, our faculty, as well as from our learners who take our training courses.
Specifically, we chose to define organizational boundaries to include staff, end users (e.g., learners), and other select behaviors associated with the organization. This includes employee, contract and part-time staff, students, instructors, staff travel, and business offices of other organizations where staff perform work for the Institute. Employees perform work from dedicated home offices, and we choose to take responsibility for emissions from these home offices. We also included emissions associated with energy consumption by our server which hosts our website and learning management system.
Most of these emissions resulted from Scope 3-related mobile combustion and Scope 3-related purchased electricity (i.e., for home offices, faculty, and our learners). We estimated emissions of both CH4 and N2O, although, CO2 was by far the dominant gas emitted. And emissions related to Institute staff and our e-learning contractor accounted for 78% of total emissions. Because half of this amount was from our contractors, one of our key lessons learned is that we need to work with our contractors to help them reduce their emissions.
Now, you might say, hey, these guys are supposed to be the experts on this stuff. And they are just doing an inventory now? Well, the Institute was founded as a nonprofit organization in November of 2007. So, our first full year of existence was not until 2008. But that was really a start up phase year, with rapid changes and new systems being developed from scratch; hardly a good baseline year to start an inventory. So we chose to use our second full year of operation, 2009, as our base year.
We also wanted to use the process of completing our inventory as an opportunity to help fulfill our own mission. For us, that meant using the whole process as a tool for capacity building. So, our inventory preparation process began with the training of two GHGMI interns using our online courses. Upon completion of the coursework, the interns developed a plan for the inventory, which included emission sources and calculation methodologies. Because of the limited guidance available for specific emission sources associated with a virtual organization operated from a network of home offices, new methodologies were adapted from existing ones. The plan was then reviewed, discussed, and approved by GHGMI management. Data collection and calculation then proceeded. Final results were reviewed and approved internally.
Further, we wanted to investigate the kind of impact not just our virtual office model had, but also what impact our focus on e-learning had. To do this we compared our emissions to that of traditional educational institutions.
Traditional universities and college campuses have large sources of emissions from purchased electricity, stationary combustion, and mobile combustion associated with campus buildings and student and faculty commuting. By creating an online learning environment, we are able to effectively educate learners worldwide while minimizing emissions associated with traditional organizations and instruction.
In order to evaluate and compare the level of GHG emissions from our services to other organizations with related educational missions, a benchmark, or ratio indicator, in the form of GHG emissions per student instructional hour was used. The specific comparison references were select U.S. universities. The expectation is that the difference between a university’s emissions and GHGMI’s would indicate the approximate magnitude reduction of emissions achieved by GHGMI relative to an organization with a traditional instructional arrangement.
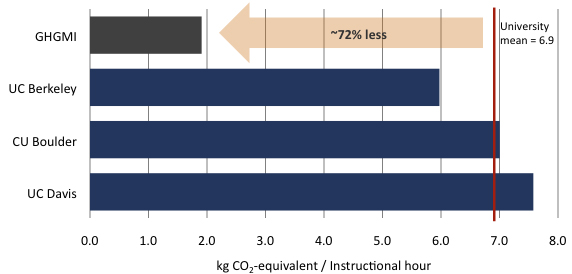
For the year 2009, we delivered a total of 12,104 instructional hours with total emissions estimated at 23.1 metric tons CO2e. Our resulting average emissions were calculated to be 1.91 kg CO2e per instructional hour.
The American College and University Presidents Climate Commitment (ACUPCC) tracks and reports the GHG inventories for 665 higher education institutions throughout the United States. These include community colleges, colleges, universities, and specialized institutes which offer undergraduate and graduate degrees. We obtained the GHG emissions inventories and student credit hour data records from the University of California, Davis, the University of California, Berkeley, and the University of Colorado, Boulder. All three universities have climate action plans and programs in progress to improve the sustainability of their campuses. Student credit hour data from each university were converted to equivalent instructional hours based on the assumption that each credit hour represented a 15 week semester and that one hour of lecture required one hour of out of class lab or homework.
Compared with the Institute, the emissions per instructional hour for these universities range from three to four times greater. In other words, this simple comparison suggests that educational organizations could reduce their emissions in the range of 60 to 75% by focusing on online learning and a virtual workplace (see Figure). The majority of emissions from these institutions are from purchased electricity and stationary combustion associated with buildings and the mobile combustion emissions from commuters to community colleges.
It should be noted that the number of instructional hours delivered by GHGMI is a fraction of those delivered by a large universities (roughly 0.04%). However, the incremental emissions associated with a doubling of output from a virtual classroom provider like GHGMI is likely to be small relative to a bricks-and-mortar institution. Therefore, the approach used by GHGMI is likely to be highly scalable without a significant increase in emissions.
The virtual environment for learning at GHGMI provides an example of how online education can successfully provide education while limiting large sources of GHG emissions associated with traditional institutions. However, further research and analysis is needed to better quantify the differences between operational models and to identify causal factors for those differences. This initial analysis is intended only as a scoping exercise to identify the order of magnitude emission reduction potential of GHGMI’s organizational model.
It is reasonable to ask whether it is really fair to compare an online course with a real university course. Well, we think that e-learning has a great deal going for it where it comes to both sustainability and learning outcomes. Our reasoning for using e-learning is that:
- Learners can proceed at their own pace, an approach that has been proven to maximize knowledge and skill acquisition;
- The course is always “on,” minimizing the delivery challenges associated with the classroom;
- The course can be taken “anytime, anywhere,” improving access for learners in all locations, meaning opportunities are not limited to those in rich countries;
- The cost of training can be minimized without sacrificing quality; and
- We can avoid the emissions associated with traveling and commuting while still providing global access to world-class instructors.
And outcomes? Are we sacrificing on quality to reach more people and avoid travel? Actually, reviews of learning effectiveness point to e-learning as not only being on par with classroom-based learning, but one of the most widely accepted studies on the matter concluded that e-learning was in fact more effective than face-to-face instruction:
“The meta-analysis found that, on average, students in online learning conditions performed better than those receiving face-to-face instruction”
– Evaluation of Evidence-Based Practices in Online Learning: A Meta-Analysis and Review of Online Learning Studies, U.S. Department of Education, 2009
This study found that superior outcomes for students engaging e-learning were explained by students tending to spend more time on online courses than the equivalent face-to-face course.
So, we achieve lower emissions, better learning outcomes, save money for our stakeholders, and provide opportunities to those in developing countries that a traditional model simply could not.
To sum up, this inventory will be the first of many annual accountings and reports to come, and will serve as the touchstone for future efforts. It also demonstrates the challenges for emissions accounting for organizations of the future while also demonstrating the potential and opportunities to achieve significant emissions reductions by embracing everything that modern information technology has to offer. The results indicate that our GHG emissions are less than half that of other NGOs and traditional learning institutions. We hope that this report will serve as an example to peer organizations for what can be achieved through innovation and a commitment to “practice what we preach” when it comes to addressing climate change.
You can download the Institute’s 2009 GHG inventory report here.
1Emission Facts: Greenhouse Gas Emissions from a Typical Passenger Vehicle. EPA420-F-05-004, February 2005. https://www.epa.gov/oms/climate/420f05004.htm
2Greenhouse gas inventories for teaching institutions are publicly available at the American College and University Presidents Climate Commitment (ACUPCC) website. https://acupcc.aashe.org/
3The following websites provide student credit hour data:
https://budget.ucdavis.edu/data-reports/documents
https://calprofilesplus.berkeley.edu/
www.colorado.edu/pba/records/fte/term0910.htm
www.colorado.edu/pba/records/fte/term0809.htm
Comments