I first took on the role as climate advisor to Los Angeles (L.A.) Mayor Eric Garcetti nearly two years ago. My job then was to develop a climate action plan (CAP) for L.A. that upholds the Paris Agreement at a city-scale, and to integrate that CAP into L.A.’s Sustainability City pLAn (“the pLAn”). I was excited, both professionally and personally. I knew I was ready to apply carbon accounting and climate action planning skills learned and taught over years of working on climate change in federal and state government, as a protocol developer for regional carbon markets, and as a teacher at GHGMI and UCLA. I was eager to help my home city do its part to prevent dangerous climate change – especially while watching my national leadership on climate change tragically crash and burn.
In my new job, I immediately got to work preparing a new greenhouse gas (GHG) inventory for the city and developing GHG emission reduction scenarios and a library of actions L.A. could take to achieve the reductions: carbon accounting 101.
Now, nearly two years later, after producing the GHG numbers and then some, I have a new understanding of the value in looking beyond those GHG numbers. With our analysis completed and published, there is general acceptance of the ambition needed to reach carbon neutrality and I think that is due largely to our work on the GHG analysis. I have also seen stakeholders and policy-makers draw connections, insights and perspective on the transformational changes needed to achieve carbon neutrality. These realizations do not stem from the GHG analysis. They come from understanding how the proposed climate policies will impact the lives of people. And the way that you connect policies to people, it seems, is by understanding other types of impacts, such as public health and jobs.
Over the past two years, I have learned to broaden my perspective of what’s important and apply new methods in conjunction with classic carbon accounting that ultimately made our work in L.A. more impactful. I am sharing this story because, as carbon managers, our work is truly fundamental to solving the climate crisis. But, it is not sufficient on its own. Instead, we must expand our concept of climate action planning.
When I joined the Mayor’s Office of Sustainability, the City of L.A. was already actively engaged with other leading cities around the world through C40 Cities Climate Leadership Group[1] to determine how cities uphold the Paris Agreement. Because L.A. was one of eight cities in a C40 pilot program, I was invited to help shape a comprehensive framework for city-level climate action planning to uphold the Paris Agreement, called the “1.5℃ CAP Framework”. I worked with counterparts in New York, Boston, Mexico City, London, Paris, Melbourne, and Durban to pilot implementation of the evolving framework as we each prepared our city’s 1.5℃ Climate Action Plans. All C40 member cities are aiming to develop a 1.5℃ CAP by 2020, including a review against the 1.5℃ CAP Framework.[2]
The 1.5℃ CAP Framework is backed by research showing how cities, collectively, can deliver 60% of the GHG reductions needed to keep atmospheric temperature rise below 1.5°C.[3] For this to happen, urgent action is needed in all cities. Thus, one of the criteria in the 1.5℃ CAP Framework requires, “… an evidence-based emissions trajectory or carbon budget that is in line with the 2050 emissions neutrality target and interim target(s) and actions identified…” This is something I knew I could do, as it fit squarely in my skillset.
Another criteria in the 1.5℃ CAP Framework is that cities must show how they will deliver “inclusive climate action.” This criteria, as a GHG emissions expert, was one I had less practice in applying. However, those of you involved in sustainable development aspects of climate change will know that having an inclusive climate action plan means that the benefits that occur as a result of the plan will be distributed as equitably as possible. This criteria not only serves to recognize that eradicating climate change, poverty, and injustice are inextricably linked, but it also reveals compelling synergies between climate action and wider social, environmental, and economic benefits. Ultimately, inclusivity criteria can provide information that allows people to see how planned policies will specifically affect the lives of people living in cities.
So, how do you demonstrate that your plan can deliver inclusive climate action? The 1.5℃ CAP Framework breaks this criteria down into two parts: (1) identify the potential wider benefits of climate action in your plan; and (2) make sure the benefits are distributed fairly and equitably.
In L.A., we had a good understanding of which benefits were important to address because several had already been identified through the process of developing the original Sustainable city pLAn (pLAn). Thus, these elements of the pLAn were reflected in LA’s targets and policies, which address air quality, livable neighborhoods, workforce development, prosperity and green jobs, and resilience, alongside L.A.s initial GHG reduction targets for ambitious climate actions. In developing the 1.5℃ CAP, we sought to describe more fully the broad social, environmental and economic benefits of climate action; and ideally, to quantify key non-GHG benefits. However, like many cities, the resources dedicated to such analyses is limited. With our time frame, scope, and budget, we had to prioritize and choose to focus on quantifying just a few of these wider benefits. Given L.A.’s circumstances, the non-GHG impacts we chose to quantify were air quality and job creation.
With some infamy, LA has a long history of air pollution. We are a car-centric city of nearly 4 million people and over 10 million in the greater L.A. region, as well as a major shipping port on the coast and oil drilling infrastructure dotting the landscape. We are nestled between a base of mountains and the edge of the ocean, causing air currents that hold pollution steady over the city for days. Our history also includes a strong, organized environmental justice community that has advocated for cleaner air in L.A.’s most disadvantaged communities since the 1970’s when the city’s air quality was at an all-time low. Recognizing that air pollution is a critical environmental health and equity issue, and the many synergies between improving air quality and combating climate change, we prioritized quantifying the air quality benefits of our climate actions.
The Mayor’s Office has been tracking green job creation since 2013 to measure progress towards the city’s target to create 150,000 green jobs by 2035. Based on this experience tracking and communicating job creation, the Mayor’s Office had learned the power of talking about jobs. We also understood that the journey to be a net zero carbon city would require significant investments in infrastructure and programs, which would impact job opportunities in L.A. We decided we needed to know the size of these potential impacts—how many jobs would be supported by the new investments we were proposing. So, we set out to quantify the impacts of L.A.’s planned climate actions on jobs.
We followed this approach:
- We started with the GHG targets and climate action targets in the original pLAn and evaluated how far they got us to carbon neutral by 2050 (note – we learned they weren’t enough).
- We used modelling scenarios[4] to develop new climate action targets that would get L.A. as close to carbon neutral as possible by 2050 with technologies and solutions existing today.
- We estimated the costs to implement as many of the climate actions as possible given available information, including both the public and private investments that would be needed to meet the targets and/or carry out planned policies.
- We used the cost estimates to then forecast jobs impacts, which we did by applying a recognized regional input-output model[5], with investment level as the input and number of jobs supported by the investment as the output. The results told us how many jobs (direct and indirect, full and part-time) would be supported by the investments, but this type of model could not tell us the net job growth or exactly what type of jobs were gained and lost.
- Then, we identified which of these climate actions were likely to also improve air quality, which for L.A. were those related to electrification of transportation, building decarbonization, and mitigating industrial emissions.
- We worked with our regional air quality management district to estimate the impacts of these actions on health outcomes, in terms of the number of avoided hospital visits and deaths, as well as avoided health-care related costs.
- We integrated the results into an updated pLAn, presenting the GHG scenarios, health outcomes, and jobs numbers in the context of the specific policies and programs intended to achieve them.
- Lastly, we rebranded the updated pLAn as LA’s Green New Deal[6].
Simple enough? Not surprisingly, the actual work did not go as smoothly as this step-by-step list suggests. I reconstructed this list in hindsight, in hopes that it will help others. The reality is there was interaction, iteration, and coordination between each of these steps. The one big lesson, if I was to do it again, I would have prioritized working on the non-GHG impacts far earlier in my work to allow more time to consider and explore the results, given their importance.
As a result of integrating non-GHG impacts into our CAP, we are able to tell a more compelling and complete story about the impact of our climate actions on the lives of people living in Los Angeles. For example, as a result of this work, we can say[7]:
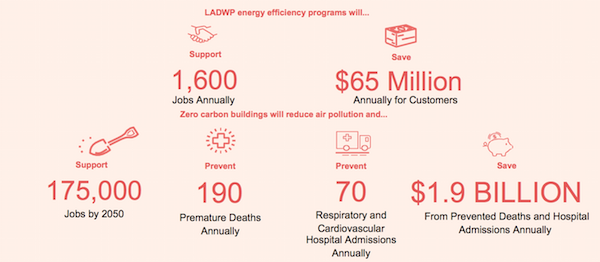
Our vision is to transform all buildings in L.A. to be extremely energy efficient and run entirely on renewable energy supplied by the grid and from on-site generation. This transformation will cut GHG emissions from buildings 100% by 2050. Renovating existing buildings and making all new buildings net zero carbon will support over 175,000 construction jobs between now and 2050. When natural gas is not combusted inside of buildings, our air will be cleaner and this will prevent 190 premature deaths and 70 hospital visits annually, and save $1.9 billion in health care costs.
Our vision is for L.A. to have a zero emission transportation system by 2050. This will cut 100% of L.A.’s on-road GHG emissions by 2050. To get there we need to install extensive EV infrastructure, which we estimate will support 1,500 jobs by 2025. Electrifying all of L.A.’s buses by 2030 will support 10,000 manufacturing jobs in Southern California. When 100% of vehicles in L.A. are electric, 980 premature deaths and 400 hospital admissions will be prevented annually, and $9.5 billion saved, because the air will be cleaner.
What becomes clear with this narrative and data is that climate actions will also improve the health and prosperity of people living in cities. As carbon accountants, our job should include evaluating and explaining how climate actions benefit all people in a city. These types of inclusivity metrics are what people can relate to. We should consider them not marginal, but essential to our work.
Take a minute and think about how radical the actions that would enable the goals I described above truly are – to never build another building that uses natural gas or another car that burns gasoline; to stop installing natural gas water heaters in homes and gas stoves in restaurants; to close down all of our corner gas stations, or better yet, transform them into EV charging hubs. Those are big moves. Scary to some. Even though we aren’t proposing that these actions happen overnight, when you put them out there, people struggle to imagine what they mean for life as they know it. If the only reason you are giving is to reduce GHG emissions, people may listen and agree, but they will have trouble embracing it. Policy makers may be reluctant to push for it, and advocates may push back on it because it’s not relatable to their lives.
Another powerful reason to evaluate other benefits, in particular economic benefits, is to be convinced and convincing that the disruptions you are proposing will not lead to economic catastrophe. Rather, I think you’ll find that your plans are actually the very essence of economic opportunity.
As a carbon accountant, my first instinct going into this process was to prioritize the GHG analysis because I was predisposed to thinking that the GHG numbers were what matters most for solving climate change. Now that I’m through the process of developing LA’s 1.5℃ CAP, my perspective has expanded. I now understand why the inclusive climate action criteria are as important. They are inextricably part of the pathway forward. As GHG professionals, it is insufficient to just run the GHG numbers. Ultimately, our goals should be to run the GHG numbers, investigate the broader impacts of the policies, and communicate in terms that are relatable to people and policy makers. Luckily for us, the designers of the Paris Agreement, thought so too.[8]
As a GHG management community, we have an opportunity to grow the paradigm of carbon accounting to include more metrics beyond GHG emissions. So, I hope you will consider new ways to account for the economic, health, and equity impacts of climate actions to understand the transformations to come in the lives of all people. I encourage you to explore and innovate and share your experience, and together we’ll keep moving the conversation forward.
[1] C40 Cities Climate Leadership Group connects 94 megacities in tackling climate change and creating resilient, sustainable, low carbon cities; the 94 cities participating in C40 represent over 700 million people and 25% of global GDP. [2] Any city is welcome to use the framework and accompanying resources provided online. [3] Deadline 2020 report [4] Using the CURB tool (Climate Action for Urban Sustainability) [5] RIMS II, developed by the U.S. Bureau of Economic Analysis [6] The Green New Deal is a resolution put forward in the U.S. House of Representatives to mobilize the U.S. government in aggressive climate action, infrastructure investment, job creation, resilience, and environmental justice. It envisions a massive investment of public resources transitioning from a fossil fuel to a clean energy economy while providing good jobs and a secure future for all. [7] In the paragraphs below, I am paraphrasing from the report and from conversations I’ve had with stakeholders about the report. [8] https://unfccc.int/process-and-meetings/the-paris-agreement/katowice-climate-package
Comments