The Revised Edition of the GHG Protocol was published[1] in 2004 (“Corporate Standard”) and it continues to be the foundation of corporate GHG accounting today. The Corporate Standard defines Scope 3 sources by exclusion, as sources that fall outside the organizational boundary delineating Scopes 1 and 2: “Scope 3 emissions are a consequence of the activities of the company, but occur from sources not owned or controlled by the company.”[2] It further characterizes Scope 3 as a framework in which a reporter may select sources that they judge are most important to track over time: “Accounting for Scope 3 emissions need not involve a full-blown GHG life cycle analysis of all products and operations. Usually, it is valuable to focus on one or two major GHG-generating activities.”[3] But, what is a “full-blown GHG life cycle analysis”? We will address this question first before differentiating types of life-cycle assessment resources and providing some guidance for applying LCAs to a corporate Scope 3 emissions inventory.
In 2011 WRI/WBCSD published the Scope 3 Standard.[4] While the Corporate Standard gives the reporter liberty to select Scope 3 sources of interest, the Scope 3 Standard changes tack and appears to require the “full-blown GHG life cycle analysis” after all: “Companies shall account for all Scope 3 emissions as defined in this standard and disclose and justify any exclusions.”[5] To support this more expansive approach, WRI/WBCSD defined fifteen categories as a framework for identifying components and boundaries of Scope 3 (Figure 1).
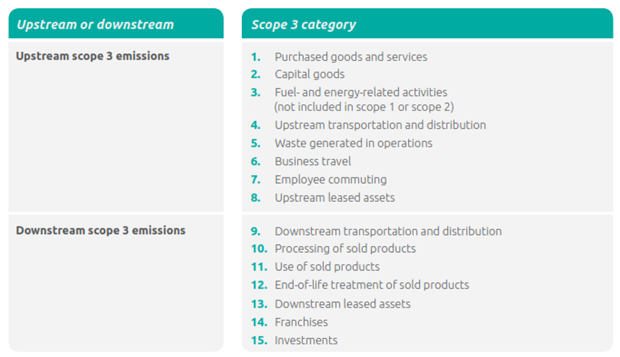
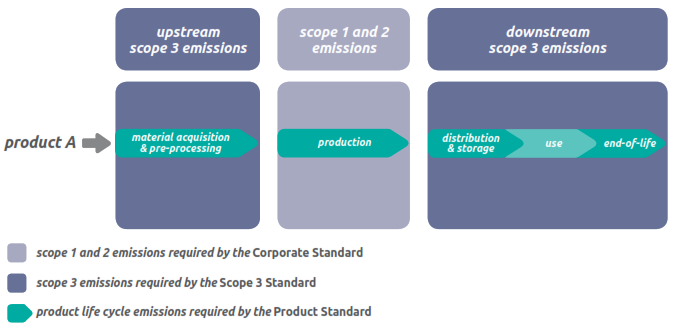
The Scope 3 Standard differentiates between the Scope 3 categories that reside “upstream” versus those “downstream.” These terms mirror concepts used in life-cycle assessment (LCA).[6] However, LCA was not developed for the purpose of accounting for the upstream and downstream emissions of organizations. Rather, LCA was developed for the purpose of evaluating the environmental impacts of a specific product or process. WRI/WBCSD acknowledged this difference by releasing a Product Standard simultaneously with the Scope 3 Standard. The Product Standard covers the lifecycle accounting of a specific product or process. Within the Scope 3 Standard, WRI/WBCSD offers a helpful diagrammatic relationship between, “upstream” and “downstream” Scope 3 accounting and, product life-cycle accounting (Figure 2).
Life-Cycle Assessment versus Life-Cycle Inventory
LCA, as defined in the literature and by ISO standards, is a broad concept. It can address numerous environmental impact categories ranging far beyond climate change (e.g., soil acidification, freshwater eutrophication, land use, or resource depletion).[7] An extensive LCA study is executed in two phases. First, a life-cycle inventory (LCI) quantifies material and energy inputs and outputs across all life-cycle stages of the subject being investigated (e.g., raw materials extraction, manufacture, transport, product use, and disposal). The inputs and outputs quantified will differ based on the environmental impact categories specified in the LCA study’s scope. If an impact category is climate change, then the inputs will include, among other things, energy consumed, while outputs will be greenhouse gas emissions. If an impact category is, for instance, eutrophication then the inputs will include, among other things, fertilizer consumed; while outputs will include, among other things, various compounds of nitrogen.
The second phase, life-cycle impact assessment (LCIA), weighs and harmonizes the outputs to common units representing each environmental impact category. For example, in the case of eutrophication, the contributions of nitrogen and phosphorus must be weighted to arrive at a common metric such as kg PO4-eq (kilograms phosphate-equivalent) released to water bodies.
Scope 3 GHG accounting is effectively a narrow application of LCA. Scope 3 GHG accounting tracks only one type of output (i.e., GHG emissions and removals) and includes no assessment or weighting of environmental impact categories.[8] There are only a few cases where GHG accounting and reporting professionals will likely benefit from directly engaging with the guidance literature and tools of LCA, and in those cases, they only need to concern themselves with the LCI phase.
Many LCA professionals make use of LCI databases that contain GHG emission factors and other impact factors of products, processes, or entire industry sectors.[9][10] The denominator of each impact factor is an activity unit. An activity unit can be a unit of volume, mass, or energy input or output by a process. Currency (money), in some cases, may be used as a proxy for an activity unit, representing a certain amount of money spent to conduct a unit amount of activity. In the case of specific products, the activity unit may be the manufacture of one unit of the product (e.g., one paper cup, one automobile).
A GHG professional who makes use of an LCI database will need to extract the GHG emission factors from the suite of impact factors in the database, and then scale the emission factors by the same activity unit appearing in their denominators (Figure 3).
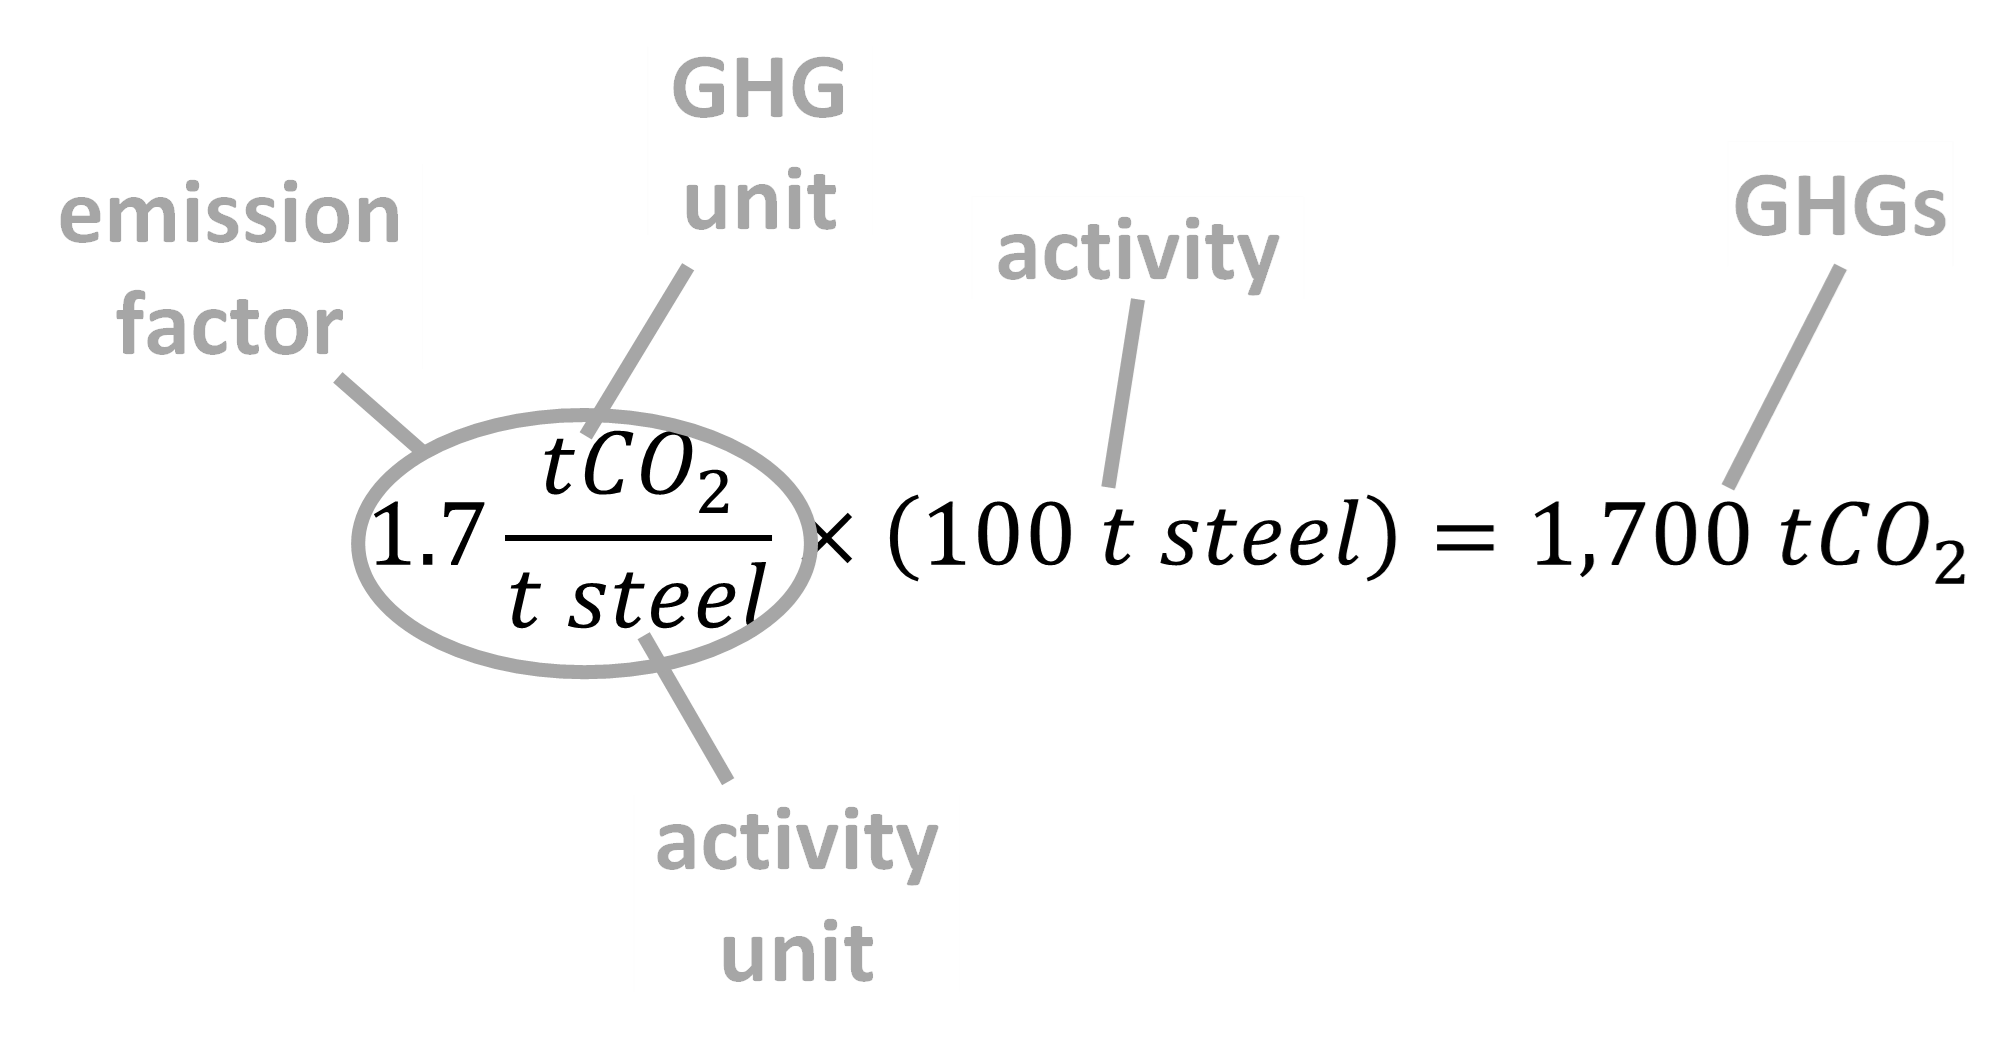
Multiplying activity data by emission factors will be a familiar task to GHG professionals, and indeed doing it is one of the commonalities between LCA practices and Scope 3 GHG accounting. That said, GHG professionals may be surprised to find that the activity unit in LCI databases is often currency. At times, emission factors drawn from LCI databases may need conversion from their currency basis to a mass or energy metric representing the Scope 3 activity. This conversion can require two subsidiary steps, first discovering the relevant price of mass or energy, and then matching the values represented in the LCI database with prices appropriate for the same timeframe.
Sources of GHG Emission Factors by Scope 3 Category
The fifteen Scope 3 categories identified by the Scope 3 Standard correlate relatively well with specific activity metrics and emission factor sources (Table 1). Of the fifteen categories only four—1. Purchased goods and services, 2. Capital goods, 3. Fuel- and energy-related activities, and 10. Processing of sold products—are likely to be evaluated utilizing factors from an LCI database.
Table 1 – Most likely activity metrics and emission factor sources for all Scope 3 categories. “WRI” means source WRI 2017.[11] “IPCC” means source IPCC 2019.[12]
| Scope 3 category | Activity metric | Emission factor source | |
|---|---|---|---|
| upstream categories | |||
| 1 | Purchased goods and services | currency | LCI database |
| 2 | Capital goods | per project | vendor's LCA study |
| 3 | Fuel- and energy-related activities (not included in Scope 1 or Scope 2) | energy | LCI database |
| 4 | Upstream transportation and distribution | mass x distance | WRI (Table 16) |
| 5 | Waste generated in operations | mass | IPCC chapter 5 |
| 6 | Business travel | distance | WRI (Table 18) |
| 7 | Employee commuting | distance, vehicle, load factor | WRI (Tables 14, 15, 18) |
| 8 | Upstream leased assets | per asset | lessor's GHG inventory |
| downstream categories | |||
| 9 | Downstream transportation and distribution | mass x distance | WRI (Table 16) |
| 10 | Processing of sold products | mass | LCI database |
| 11 | Use of sold products | units x fuel/unit | WRI (Tables 1, 2, 3, 12, 13) |
| 12 | End-of-life treatments of sold products | units | IPCC chapter 5 |
| 13 | Downstream leased assets | per asset | lessee's GHG inventory |
| 14 | Franchises | per franchise | franchise's GHG inventory |
| 15 | Investments | currency | carbon disclosure rules |
In the case of 1. Purchased goods and services, the default activity metric is currency, and an LCI database will be a good fit for estimating GHG emissions from a purchasing activity.
In the case of 2. Capital goods, the inventorying organization may utilize an LCI database directly for relatively small capital acquisitions (e.g., a car). But for larger acquisitions, the inventorying organization will be better served by requiring the capital good vendor to supply their own LCA study (addressing GHGs) as a term of purchase. Note, this request is likely to be successful when the capital good is a building, given that the architectural profession has a deep history with LCA. Building developers can often provide LCI studies of upstream emissions of building materials, construction emissions at building sites, and sometimes even emissions due to land clearing.
Finding and Using LCI Databases
LCI databases are characterized by three major parameters: region, sector, and methodology.
Region refers to the location where the database assumes the product will be consumed. Some databases focus on a single country or region, while others attempt to encompass the entire globe. Virtually every database evaluating final consumption in a geographically constrained area will still look globally to identify upstream emission sources. For example, the U.S. environmentally extended input-output (USEEIO) model (see Table 2) can only be used to evaluate the environmental impacts of goods or services purchased in the U.S., but for any given U.S. purchase it includes the emissions associated with materials imported from the rest of the world. In fact, in the case of USEEIO, the user is given the option to disaggregate those upstream emissions occurring inside the U.S. from upstream emissions occurring in the rest of the world.[13]
Sector refers to the portion of the economy on which the LCI database focuses. Some LCI databases attempt to be economy-wide, but others focus on a single economic sector. For example, Blonk Sustainability’s Agri-footprint (see Table 2) is a process-based database limited to food and agricultural commodities. If you are assembling a Scope 3 inventory for a dairy farm, Agri-footprint can provide LCI data for the various components of cattle feed at a level of detail far beyond what can be found in economy-wide LCI databases. However, you will still need to supplement this specialized LCI data with an economy-wide source when inventorying non-agricultural products within Category 1 Purchased goods and services.
Methodology refers to the set of guiding instructions and requirements used to determine LCI values. Methodologies can be broadly categorized as either following 1) a process-based LCI or 2) economic EEIO tables.
- LCI databases that follow process-based methodologies compile impact factors from individual studies of distinct products, processes, or industries that are either reported directly to the LCI database or published in academic literature. These are studies on the inputs and outputs underlying an LCI such as the Agri-footprint database described above. Process-based LCI databases attempt to build from the “bottom-up” a comprehensive depiction of the diverse population of emission sources associated with a product, process, or industry. For example, to fully cover just the automotive industry, the LCI database steward may need to assemble data evaluating fuels, conventional vehicle manufacture, electric vehicle manufacture, vehicle maintenance, and end-of-life disposal. Unfortunately, process-based LCI databases include only a limited range of product types because only a fraction of the available products have been subject to LCA.[14]
- Environmentally extended economic input-output (I/O) tables attempt to comprehensively describe the behavior of an entire economy from “the top-down” using national economic statistical accounts that sum all production, consumption, imports, and exports among a standardized set of industries. The I/O tables represent the entire national economy categorized into a limited number of sectors. The sectors can be broad, for example, “agriculture”, “construction”, or “manufacturing”, or several hundred sectors can be listed, representing a milieu of subsectors such as “oilseed farming”, “multifamily residential structures”, or “concrete pipe, brick, and block manufacturing”. Many countries publish several sets of their national I/O tables, each with a different level of sectoral disaggregation.
These I/O tables show how much industry activity is induced in all other sectors for each unit of currency spent in one sector. I/O tables were originally developed as an economic impact analysis tool; hence, the term “environmentally extended” is added to describe its application to LCI. An I/O table derives an impact factor per unit of currency spent in each sector by assigning impact intensities per unit of currency by the industry activity to all of the sectors affected (directly or indirectly) by the transaction. For our purposes, let’s say these impact intensities are GHG emissions per dollar of industry activity. If the I/O table aggregates activities into broad sectoral categories, one such intensity might be metric tons of CO2 emissions per dollar of manufacturing activity. But if the I/O table disaggregates to more granular activities, the intensity might be metric tons of CO2 emissions per dollar of concrete pipe, brick, or block manufacturing. Still, when an LCI database is based on I/O tables, even the most detailed disaggregation of sectors usually produces results based on sectoral averages that are considerably more generalized (“concrete pipe, brick, and block manufacturing”) than the level of specificity preferred for preparing a Scope 3 inventory (e.g., “36-inch reinforced concrete pipe”).
Table 2 presents a sampling of available LCI databases showing their region, sector, and methodology. This list is not comprehensive but does include the most commonly used LCI databases and a few specialized examples for illustration.
Table 2 – Sample of available LCI databases. See following body text for explanation of column “user interface.”
| LCI database | Region | Sector | Methodology | User interface |
|---|---|---|---|---|
| ADEME Agribalyse | France | agriculture & food | process | direct; SimaPro |
| Australian input-output database | Australia | all | I/O | SimaPro |
| Blonk Agri-footprint | global | agriculture & food | process | direct; SimaPro; openLCA |
| cm.chemicals | global | chemicals & plastics | process | on-demand; openLCA |
| DATASMART LCI | USA | all | process | SimaPro |
| ecoinvent | global | all | process | direct; most LCA software |
| ecosystem WEEE LCI | France | electronics (end-of-life only) | process | direct |
| Environmental Footprint database | EU | all | process | direct; most LCA software |
| ESU World Food LCA Database | Switzerland | food | process | on-demand; direct; SimaPro |
| EXIOBASE 3 | 44 countries (28 in the EU) | all | I/O | direct |
| GaBi LCI Databases | global | all | process | on-demand; GaBi LCA software |
| Greenhouse gases, Regulated Emissions, and Energy use in Technologies Model (GREET) | USA | fuels & transportation | process | direct |
| Inventory Database for Environmental Analysis (IDEA) | Japan | all | hybrid | direct; SimaPro; openLCA |
| U.S. Environmentally-Extended Input-Output Model (USEEIO) | USA | all | I/O | direct; SimaPro; openLCA |
| U.S. LCI Database | USA | all | process | direct |
Extracting GHG emission factors from an LCI database is not a simple exercise. In the cases where a direct download of the LCI database is available (i.e., “direct” in column user interface of Table 2) substantial time is required to familiarize yourself with the downloaded files and LCA practice knowledge is needed to interpret their contents correctly. You will find the exercise easier if you are already familiar with the user interfaces of other LCA software packages such as PRé SimaPro, sphera GaBi, or GreenDelta openLCA. If you are not already familiar with one of these LCA software packages, the required effort to extract the appropriate GHG emission factor from the LCI database may outweigh its value to you.
A few LCI database vendors offer an “on-demand” data service. For a consulting fee, the vendor will extract emission factors or other data as requested. I recommend that any GHG professional not already familiar with a LCA software package consider utilizing an on-demand service; the price will likely be below that of your labor to navigate the alternatives and this service reduces the risk of extracting an inappropriate factor.
Lastly, it should be noted that when extracting GHG emission factors from LCI databases, GHG professionals should be aware of these defining assumptions of an LCA study’s applicability:
- System boundary: In the case of process-based LCIs, the study author will have made certain assumptions about the system boundaries. These assumptions differ significantly from LCA study to LCA study. System boundaries dictate how far upstream the study’s authors measured inputs and outputs. One approach is to use engineering estimates of all known subprocesses contributing to each input (e.g., fuel) or output (e.g., GHGs) and collect only field data for the largest subprocesses that constitute a chosen minimum percentage (for example, 95%) of the estimated total. There are many approaches for determining system boundaries, which will involve subjective judgments.
- Life cycle stages: Some LCA studies include only “upstream” emissions of production and material extraction stages, while others combine these with use-stage and end-of-life emissions (Figure 4). LCA studies that include all five stages are described as “cradle-to-grave,” while LCA studies that consider only an upstream subset of the life cycle stages are typically described as “cradle-to-gate.” However, the location of the “gate” is often ambiguous and can vary between LCA studies. An accurate interpretation of LCI data referencing “gates” will require review of the underlying LCA study.[15]
- Gases and GWPs: Where GHG emissions are reported, the user needs to know which gases were included, and the GWPs used to combine them. GWPs are updated with each successive IPCC report, but some organizations delay their adoption of the latest GWPs for program continuity.
- Study vintage: The year in which the study was conducted. See the section below on “Tracking Scope 3 Emissions over Time” for a discussion of temporal considerations.
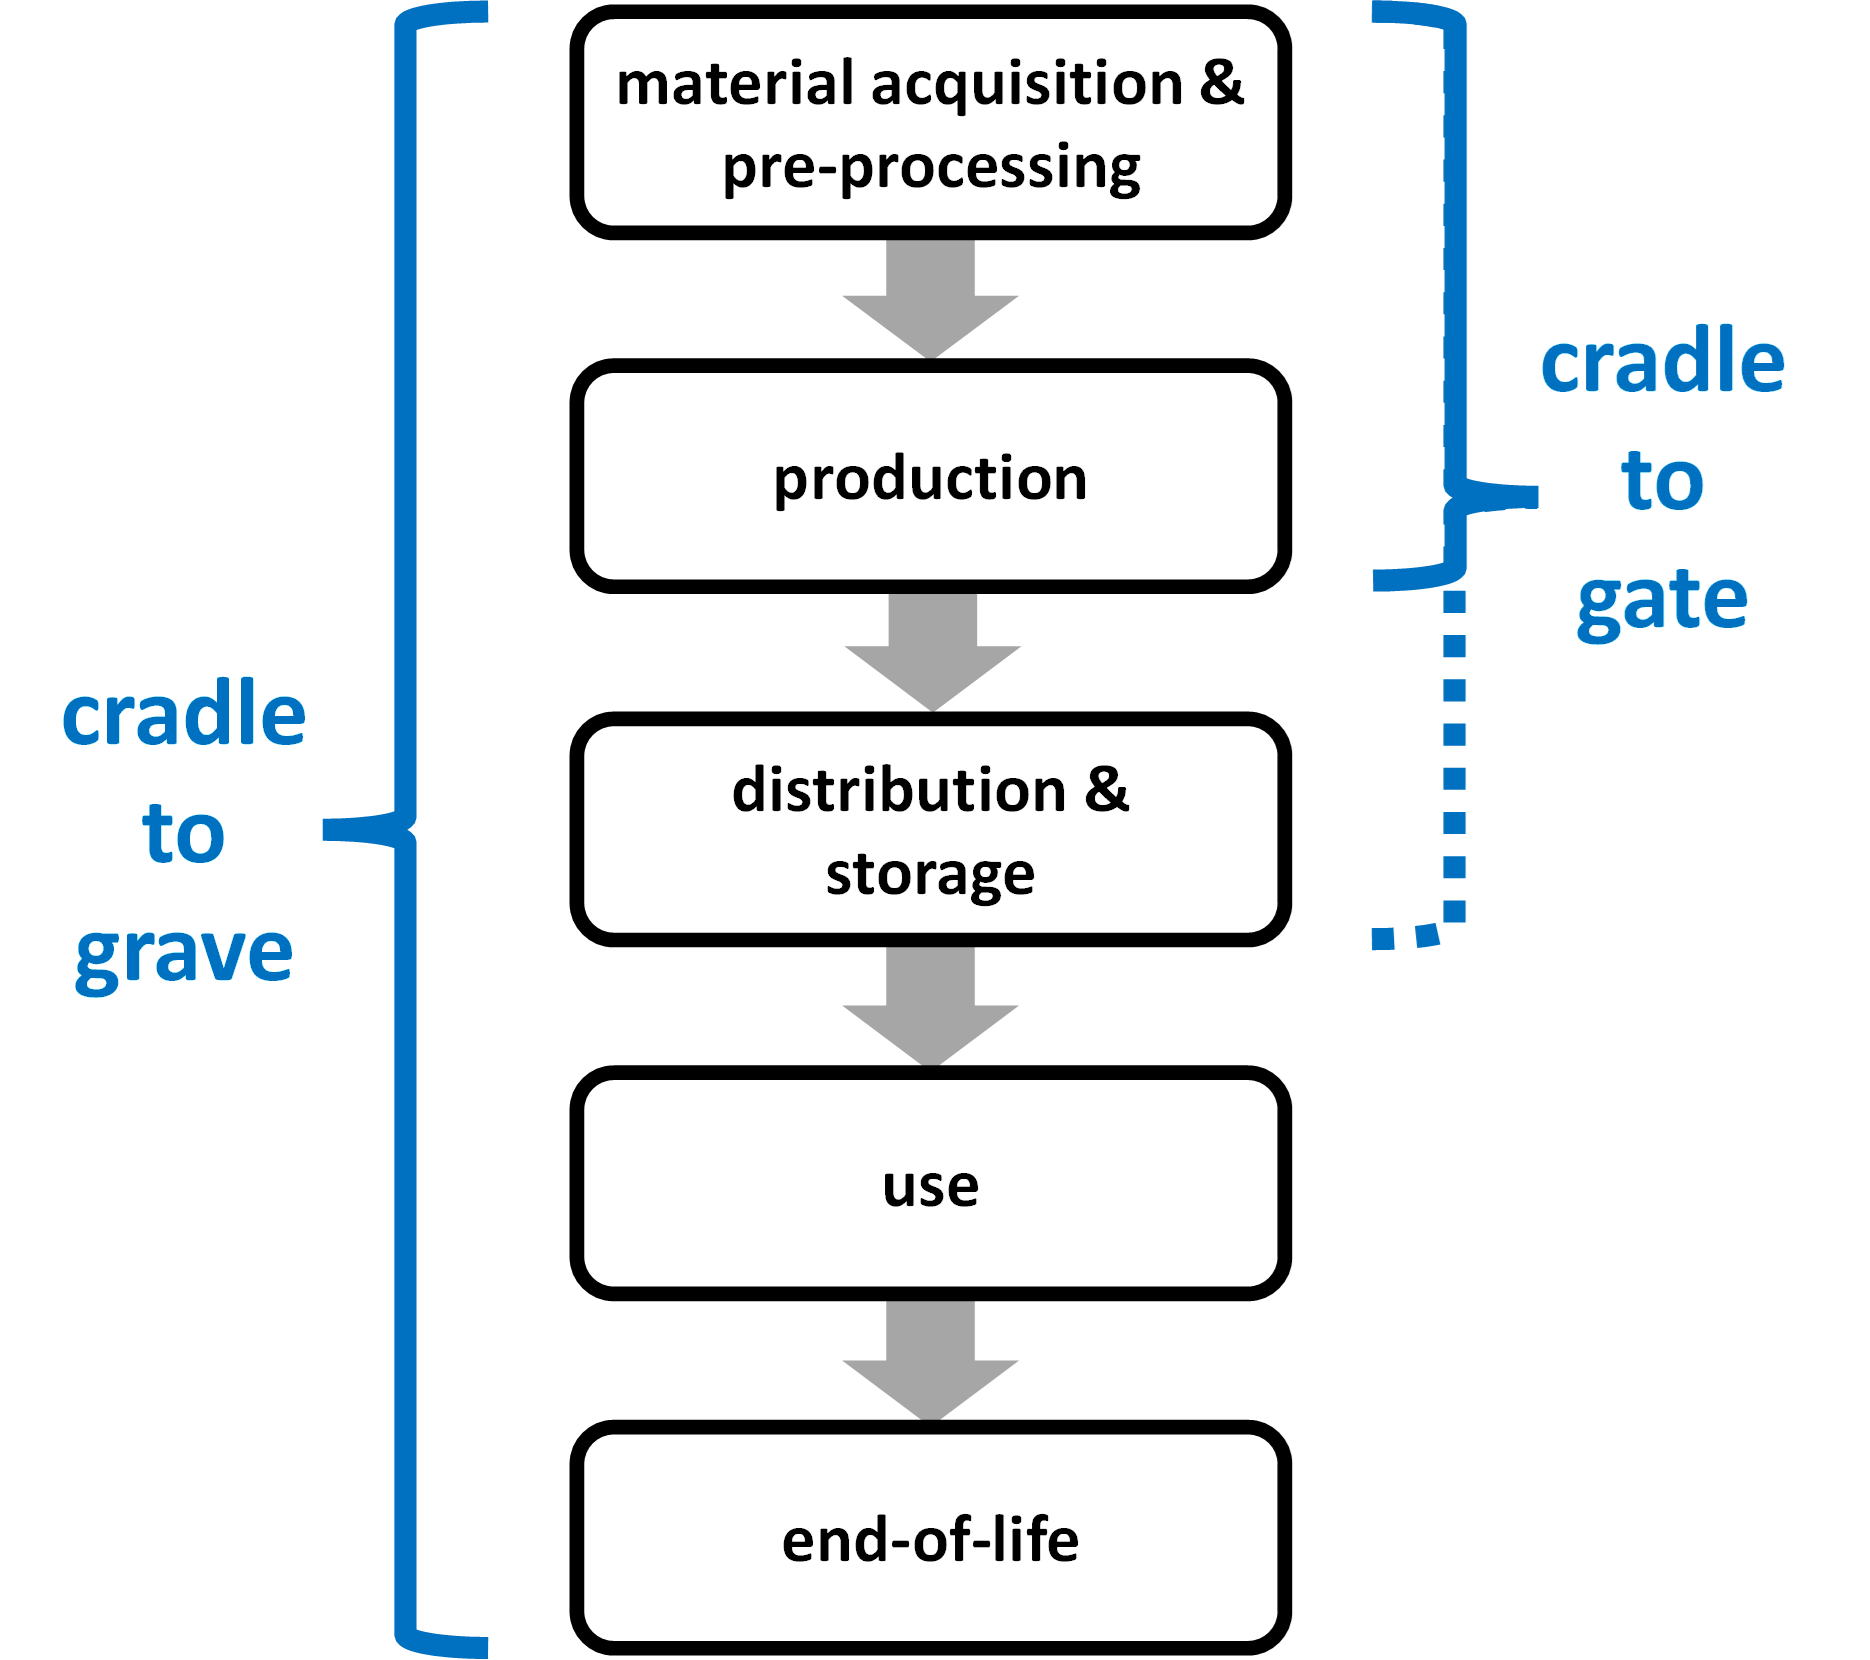
Figure 4 – Use of the nomenclature “cradle to grave” and “cradle to gate.” The location of the “gate” in the latter term is ambiguous and will need to be extracted from the study report.
Without uncovering these key assumptions in LCAs, you may be unable to ensure that the extracted LCI database emission factors are appropriately representative for your intended use. Again, the unfortunate truth is that it can be challenging to utilize an LCI database without existing familiarity with one of the LCA software packages.
Environmental Product Declarations
As defined by the international standard ISO 14025, an environmental product declaration (EPD) “quantifies environmental information on the life cycle of a product to enable comparisons between products fulfilling the same function”. An EPD may be issued by a product’s manufacturer to publicly report the results of an LCA study for their product. The LCA study is verified by a third party before the EPD is issued. A central, international repository of EPDs[16] makes access straightforward and free, since EPDs are, by ISO definition, public documents.
The architecture industry was an early adopter of the EPD system, and for some projects, architects require EPDs for all inputs to a project to total the environmental impacts of the entire project for their client. There are more EPDs available for building materials than for any other product category.
Almost all EPDs include a GHG intensity value within their declarations. If an EPD exists for a product, it can provide an accessible and specific GHG emission factor.
Tracking Scope 3 Emissions over Time
GHG inventories are typically updated annually, but any GHG emission factors taken from an LCI database are updated on a much lower frequency. I/O databases are a snapshot in time drawn from national I/O accounts of a single, historical year prior to the release of the LCI database. Environmentally extended I/O tables are not updated annually, rather updates occur on longer, usually decadal, time scales. Process-based databases compile novel LCA studies that are almost never performed with the intention to update their findings annually; in fact, many of these studies have never been repeated at all.
For any GHG emission factor extracted from an LCI database, the vintage of the underlying LCA study is critical to know, especially if the activity metric is currency. The LCI database user will need to align (i.e., adjust for long-term price shifts and inflation) currency values from the LCA study year to the GHG inventory year. Currency value adjustment based solely on inflation will introduce added uncertainty since inflation is typically quantified according to the prices of a commodity bundle that may or may not correlate well to the price of the specific commodity being inventoried.
Of course, if the activity metric is a physical quantity, then currency inflation adjustment is unnecessary. However, the vintage remains important as production processes can change significantly over time. For instance, the declining GHG intensity of grid electricity over the past years can significantly affect the representativeness of LCI-extracted GHG emission factors.
In your GHG emission inventories, you should document the vintage of LCI database extracted emission factors as well as any vintage-based adjustments that are applied.
Conclusion
The best method for computing Scope 3 emissions varies among the fifteen Scope 3 categories. LCI databases are called into play for Category 1. Purchased goods and services, Category 3. Fuel- and energy-related activities, and Category 10. Processing of sold products. LCI databases are also called into play for Category 2. Capital goods, but for this category, it will most likely be the capital goods vendor who is responsible for compiling the LCI data.
LCI databases are not user-friendly and require significant expertise. If an organization does not have access to or familiarity with an LCA software package, then extracting GHG emission factors may be accomplished by the LCI database owner’s “on-demand” data service (if available).
If an organization is attempting to include a large number of sources within Category 1. Purchased goods & services, an I/O database may conveniently provide the necessary emission factors from a single source. Although the precision per product purchased may be lower than locating individual emission factors per product from process-based databases, coverage of all products can be achieved with less effort. Emission factors for Category 10. Downstream processing of sold products sources are most likely to originate from process-based databases.
Lastly, as a GHG professional, you are cautioned that extracted factors will not reflect annual changes in emissions intensities (e.g., production technologies and other factors affecting per activity unit Scope 3 GHG emissions), which will add uncertainty and/or require further adjustment to facilitate their appropriate application.
Acknowledgments
I am grateful for the edits, revisions, and contributions by Michael Gillenwater (GHGMI), Alissa Benchimol (GHGMI), Tani Colbert-Sangree (GHGMI), and Keri Enright-Kato (GHGMI) to develop this piece.
Author
Roel Hammerschlag is the principal of Hammerschlag & Co. LLC. Areas of professional focus are greenhouse gas inventories, greenhouse gas regulation, communication of climate science, life-cycle assessments of fuels, and fates of nuclear waste. From 2010-2013, Mr. Hammerschlag served Washington State as the program manager for Washington’s State Energy Strategy, and from 2007-2010 Stockholm Environment Institute engaged him in the role of Senior Scientist. In 2003 the MacArthur Foundation awarded Mr. Hammerschlag and Patrick Mazza a Grant for Research and Writing examining limits to hydrogen fuel. Mr. Hammerschlag earned a Bachelor of Science in Physics from the Massachusetts Institute of Technology in 1988, and a Master of Public Administration at the University of Washington in 2007, supported by fellowships from the UW Program on Climate Change and the Henry M. Jackson Foundation.
Recommended Citation
Hammerschlag, R., (2023). Exploring life-cycle assessment resources: guidance for Scope 3 GHG accounting. Greenhouse Gas Management Institute, April 2023. https://ghginstitute.org/wp-content/uploads/2023/05/Scope-3-Emission-Factor-Sources-23.05.10-1.pdf
Cover photo: Ghodrati, Behzad & AL-Chalabi, Hussan & Hoseinie, Seyed Hadi. (2016). Environment–Friendly manufacturing and support—Issues and challenges. 157-163. 10.1142/9789813141124_0023.
[1] World Business Council for Sustainable Development and World Resources Institute, “The Greenhouse Gas Protocol: A Corporate Accounting and Reporting Standard, Revised Edition” (World Resources Institute, March 2004), https://www.ghgprotocol.org/. [2] World Business Council for Sustainable Development and World Resources Institute, 25. [3] World Business Council for Sustainable Development and World Resources Institute, 29. [4] World Resources Institute and World Business Council for Sustainable Development, “Corporate Value Chain (Scope 3) Accounting and Reporting Standard” (WRI, September 2011). [5] World Resources Institute and World Business Council for Sustainable Development, 60. [6] Though the terms “upstream” and “downstream” are ubiquitous in conversational communications on LCA, they are less common in the academic literature on LCA and are undefined in the ISO standards guiding LCA practice (ISO, “ISO 14040:2006 Environmental Management – Life Cycle Assessment – Principles and Framework” (ISO, July 1, 2006). ISO, “ISO 14044:2006 Environmental Management – Life Cycle Assessment – Requirements and Guidelines” (ISO, July 1, 2006).) The absence of these terms from the formal literature does not mean that the connection to LCA is irrelevant, but rather that the terms are too broadly defined to be applied when rigorously defining LCA practices. [7] The full breadth of LCA includes not just allocational assessments of steady-state processes, but also consequential assessments of economic, procedural, or policy changes. Most corporate GHG inventories are more closely related to allocational assessments (historically called “attributional” assessments). [8] Technically, the application of global warming potentials (GWPs) to express multiple GHGs in terms of carbon dioxide equivalents (CO2e) is a weighting of outputs and falls under the rubric LCIA rather than LCI. To rigorously exclude LCIA from this memorandum’s scope one may read with the understanding that the various GHGs are accounted for separately. That said, GWPs are agreed upon internationally through the Intergovernmental Panel on Climate Change (IPCC) and applied de rigueur in GHG accounting practice. Some parties might argue that GHGs expressed in CO2e are a unary process output that may be tabulated as such in the LCI phase, rather than assembled from their underlying gases in the LCIA phase. [9] Not all LCA studies rely on LCI databases, or even on impact factors. Some types of LCA studies are most accurate and relevant when the process inputs and outputs are drawn from primary sources such as emission monitoring equipment, land use surveys, bills of lading, production records, chemical formulae, laboratory tests, or process studies. [10] The term “emission factor” familiar to GHG professionals is simply a narrower application of the generalized “impact factor” discussed by LCA practitioners. [11] World Resources Institute, “Emission_Factors_from_Cross_Sector_Tools_March_2017.Xlsx,” Microsoft Excel (World Resources Institute (WRI), March 2017). [12] Intergovernmental Panel on Climate Change, “2019 Refinement to the 2006 IPCC Guidelines for National Greenhouse Gas Inventories, Volume 5: Waste” (IPCC, 2019). [13] Wesley W. Ingwersen et al., “USEEIO v2.0, The US Environmentally-Extended Input-Output Model v2.0,” Scientific Data 9, no. 1 (May 3, 2022): 194, https://doi.org/10.1038/s41597-022-01293-7 [14] Note that “process-based” refers to the LCI methodology, not to the objects in the database. Product, process, and industry-wide emission factors can all be found in process-based LCI databases. [15] There has been considerable additional and creative nomenclature used, including “cradle-to-cradle,” “cradle-to-shelf,” “gate-to-gate” (for studies examining an intermediate portion of the life-cycle stages), and so forth. LCAs on fuels adopt a separate but parallel nomenclature, “well-to-wheels” and “well-to-tank,” also featuring creative variants, such as “well-to-wake” referring to marine applications. These terms are unstandardized. Always verify the actual study boundary from the study report. [16] https://www.environdec.com/library. When a manufacturer has created an ISO-14025 compliant EPD for their product, there is no requirement for the manufacturer to report the EPD to the International EPD System. So, manufacturers should be asked whether an EPD exists.
Comments