If you’re a greenhouse gas (GHG) expert, you know emission factors (EFs) are an essential input to your work in carbon accounting. While performing emissions calculations you have surely experienced the challenge of locating and identifying the most representative and up-to-date EF for your work. This blog is here to help you the next time you begin this task by identifying the major EF databases available for your use. But first, let’s cover the basics…what is an emission factor?
According to the U.S. Environmental Protection Agency (US EPA), EFs are defined as “a representative value that attempts to relate the quantity of a pollutant released to the atmosphere with an activity associated with the release of that pollutant.”[1] Typically for GHGs, EFs are expressed as the mass of a gas per unit of the emissions-producing activity or material input, such as kilograms of carbon dioxide (CO2) emitted per tonne of bituminous coal combusted.[2]
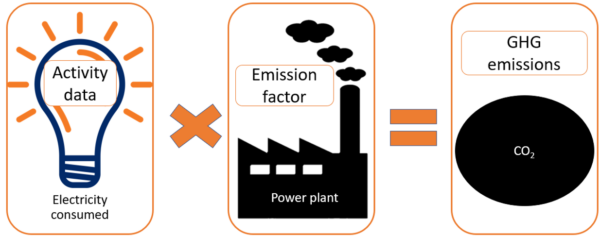
To estimate emissions, an EF is multiplied by the corresponding activity data such as the production output of a manufacturing plant, the energy contained in a mass of fuel combusted, or the amount of electricity consumed. Activity data need to be converted to match the units used by the EF to calculate GHG emissions. The basic formula is:
How are emission factors developed?
Emission factors may be quantified in a handful of ways. They can be developed using an understanding of stoichiometry for processes that strictly follow clear chemical or mass balance reactions, or they can be developed empirically through statistical sample measurements. Numerous studies have been published for most emission sources in the peer-reviewed scientific literature to inform EFs (see Table 2: Emission Factor Databases and Resources). EFs can also be based on expert judgment by evaluating all the available evidence to produce a representative average emissions rate for a specific technology.
EFs vary in the breadth of activity or activities they cover. Typically, in GHG accounting, EFs address a single source category, such as CO2 emissions resulting from the combustion of motor gasoline (petrol) in light-duty on-road vehicles. However, some EFs serve as integrated (or aggregated) values across multiple sources, processes, or value chains (e.g., upstream CO2 and CH4 emissions associated with gasoline consumption – which incorporates emissions occurring from unrefined fossil fuel extraction, fuel processing, transportation, fugitive releases, as well as combustion). These broader EFs are often developed by applying environmental life-cycle analysis. Examples of single-source emission factors are presented in Table 1.
Table 1: Examples of GHG Emission Factors
| Emission Source | Example EF Units | Considerations | |
|---|---|---|---|
| Stationary combustion | • kg CO2 / tonne • kg CO2 / Btu or MJ • kg CO2 / scf or m3 • kg CO2 / gallon or L | EFs are generally estimated based on sample measurements of the average carbon content of the fuel and then applied to activity data collected in energy units (e.g., MJ or Btu) rather than units of mass or volume.* Some standard fuels may have EFs expressed in mass or volume, but only when there is high consistency in the fuel. Fuel type and characteristics combusted must match the EF selected and appropriate units of mass. |
|
| Mobile combustion | • kg CO2 / scf or m3 • kg CO2 / gallon or L |
||
| Fugitive CH4 (gas transmission & storage) | CH4 / million m3 of marketable gas | These EFs typically set a default rate for fugitive CH4 emissions assuming typical steady-state leak rates and typical frequency of intermittent leak rates across a range of equipment (e.g., valves, compressors), maintenance activities, and equipment malfunctions. | |
| *The carbon content of fuels is correlated to their energy content. Therefore, activity data reported in energy units produces more accurate emission estimates. | |||
EFs are also distinguished as direct or indirect. Direct EFs identify the emissions physically released to the atmosphere by the activity being inventoried (e.g., an EF would provide the rate of methane produced from a quantity of waste that is decomposing anaerobically over time) and are developed as described above. Indirect EFs are used to estimate emissions from an activity, but the emissions physically occur from a separate intermediate activity that results from the original activity.[3] For example, an indirect EF would provide the rate of emissions that result from electricity consumed by an office building even though the direct emissions actually occur at power plants that combust fuel to generate electricity for the building’s use. An electrical grid EF is an indirect EF that proportionally averages the various power producers and fuels combusted to supply electricity to a utility’s customers. The EF in Figure 1 would be an indirect grid EF.
What’s more accurate using direct measurement or an EF?
Like me, you probably learned that direct emissions measurement – source-specific emission tests or continuous emissions monitoring (e.g., CEMS) – produces more representative and accurate results than emissions estimation using an EF. However, due to the uncertainties with measuring the mass flow through a stack, direct measurement is not always the most accurate emissions quantification method. For example, quantifying CO2 emissions from fuel combustion released from a power plant stack using direct gas flow and concentration monitoring devices still involves significant uncertainty.[4] Also, the emissions of CO2 from fuel combustion are close to perfectly correlated with the carbon content (i.e., mass fraction) of the fuel being oxidized.[5]
These carbon content values can be precisely measured through laboratory testing and then used as the basis for fuel combustion CO2 EFs. In addition to these general considerations, determining the most accurate method for CO2 estimation depends on the possible variability of a fuel’s composition (e.g., is this unit of gasoline chemically the same as the EFs reference unit?), uncertainty of the measurement equipment (e.g., how precise is the equipment?), and the equipment’s calibration (e.g., how much error is acceptable for equipment to be deemed calibrated?).
In contrast to CO2 EFs for fuel combustion that are based on a carbon mass balance, for many non-CO2 emission sources the operational conditions of the activity (e.g., the ambient temperature when combusting gasoline in an engine) will often influence the emissions that result from the activity.[6] For these sources, direct measurement, performed competently, can be more accurate than using EFs, especially EFs that are not specific to a technology and operating conditions. The catch is, for many source categories, it is impractical to directly measure emissions (e.g., diffuse methane leaks along a natural gas pipeline network or N2O releases from fertilized croplands).
When direct emissions measurement is not feasible or will not increase the accuracy of the calculation, the use of EFs is appropriate.
Locating an Appropriate EF
Not all countries or researchers compile their EFs in the same way. When searching for an EF make sure to check that the following considerations match your intended use of the EF:
- Geographic relevance – EFs typically correspond to specified geographic areas, but for some emission sources location is irrelevant.
- Scale of application – EFs can be representative at various scales:
- National or regional – an EF can represent the average emissions rate for a specified activity occurring at a national or regional scale and thereby may represent a range of specific technologies and practices (e.g., national steel production).
- Site-specific – an EF can be applied to represent the emissions rate for an activity occurring at a specific facility or place using specified technologies (e.g., steel production from a plant in Texas using coal-fired blast furnace technology).
An EF may be appropriate to use only when it is representative of its intended use. For example, a site-specific EF does not represent an average of practices for the entire country in which is it located.
Some simple steps you can take to avoid common EF errors include:
- Reference – Ensure that EFs come from a reliable reference (e.g., peer-reviewed literature, government agencies, IPCC Guidelines, National Inventory Reports).
- Activity scope – EFs specify the activity(ies) to which they are applicable and may specify geographic or contextual applicability limits for these activities.
- Units – Be aware of how EFs are presented so you know what unit conversions will be required. The most common errors in emission inventories are simple unit conversion errors.
The IPCC Guidelines for national GHG inventories provide guidance on selecting EFs and related data quality issues. Importantly, the guidelines also provide valuable information on the uncertainties associated with each default EF they include.[7] Generally speaking, the more representative an EF is of the situation at hand the more accurate it should be. For example, if you are evaluating emissions from dairy cows, a regional default EF value would produce a less accurate result than an EF specific to the breed and national context. In general, the choice of EF requires a judgment of representativeness with respect to the local context and technology being evaluated. One exception is stoichiometric EFs, which reflect known chemical reactions. Due to their uniformity, stoichiometric EFs are highly accurate across contexts and should be prioritized for use, for example, when evaluating CO2 emissions from lime production (the input material for construction not the fruit).
With these considerations in mind, here is a list of publicly available EF databases along with descriptive information. If you are confused about the difference between GHG accounting done for the purposes of inventories, such as for countries or companies, and GHG accounting at the project-level to quantify avoided emissions (or removal enhancements), then you should read this blog post.
Table 2: Emission Factor Databases and Resources
| EF Database or Resource | Scale of Application | Activity Scope | Source(s) |
|---|---|---|---|
| Intergovernmental Panel on Climate Change (IPCC) Emission Factor Database (EFDB) | Intended for use at the national scale and may be applicable at the project level. Includes national emission factors and in some cases regional EFs where available. | Direct EFs for source and sink categories across all sectors: • Energy & Industrial Processes and Product Use sectors: o Fuel combustion o Energy sector o Gas pipeline leakage • Waste sector • Agriculture, Forestry, and Other Land Use sector: o Biomass accumulation o Fertilizer use Indirect EFs: • Waste sector • Agriculture, Forestry, and Other Land Use sector • Other: o Indirect nitrous oxide emissions from the atmospheric deposition of nitrogen | • Broadly sourced with EFDB Editorial Board evaluation and approval • IPCC guidelines & default data • Peer-reviewed journals (e.g., Carbon Management Journal) • Other publications (e.g., National Inventory Reports, National Communications) |
| Institute for Global Environmental Strategies (IGES) List of Grid Emission Factors | Intended for use at the project level for quantifying emission reductions. Factors are specific to defined national and regional contexts. | Indirect EFs: • Electricity consumption (i.e., grid EFs) • Marginal (avoided) electricity consumption | • Clean Development Mechanism (CDM) offset project database and CDM-approved standardized baselines • Official grid EFs published by governments |
| World Resources Institute (WRI) and World Business Council for Sustainable Development (WBCSD) Greenhouse Gas Protocol Calculation Tools* | Calculation tools are intended for use at the corporate level. Tools provide EFs and guidance to evaluate specific emissions-producing activities. Some EFs specify applicable industries. Some EFs specify applicable country contexts. | Direct EFs: • Stationary combustion • Transportation (e.g., vehicle distance, freight, public transport) • Refrigeration and air-conditioning equipment • Production of aluminum, adipic acid, ammonia, cement, iron & steel, HCFC-22, nitric acid, pulp & paper, semiconductors, wood, and lime • Production of cement (for China & India) • Production of pulp & paper (for Mexico) Indirect EFs: • United States (U.S.) electricity by region • China/Taiwan electricity by region | • WRI & WBCSD publications • IPCC guidelines & default data • Peer-reviewed journals (e.g., Carbon Management Journal) • Other government publications (e.g., National Inventory Reports) |
| US EPA Air Emissions Factors AP-42 Note: the database includes other non-GHG air pollutants. | Intended for use at the process and project level.** | Direct EFs: • external combustion sources • solid waste disposal • stationary internal combustion sources • evaporation loss sources • petroleum industry • organic chemical process industry • liquid storage tanks • inorganic chemical industry • food and agricultural industries • wood products industry • mineral products industry • metallurgical industry • biogenic sources • ordnance detonation • miscellaneous sources Excludes: • Carbon removal activities (e.g., biomass growth, technological carbon capture) | • Published by US EPA Office of Air Quality Planning and Standards |
| US EPA Emissions and Generation Resource Integrated Database (eGRID)*** Note: the database includes other non-GHG air pollutants. | Intended for use at the corporate and project level. Covers the USA with regional average EFs. | Indirect EFs: • Electricity consumption • Transmission and distribution (T&D) line loss factors | • Published by USEPA Office of Atmospheric Programs |
| The Climate Registry’s (TCR) Default Emission Factors - 2024**** | Intended for use at the corporate and project level. Provides regional factors for the USA and Canada, utility-specific-EFs for the USA, and national grid average EFs for many other countries. | Direct EFs: • Stationary combustion EFs (for the USA and Canada) including EFs specific to the following sectors: o Electricity generation o Industrial o Commercial o Energy o Residential • Mobile combustion EFs (for the USA and Canada) • Fugitive EFs including for refrigeration and air conditioning equipment and geothermal energy Indirect EFs: • Electricity consumption: o U.S. eGRID region (2019) and utility (2005-2019) o Canadian province (2018) o Mexico (2000-2019 national averages) o Other countries (2010 and 2011 – national averages) | • Official government publications • IPCC guidelines & default data |
| Carbon Footprint Country-Specific Electricity Grid Greenhouse Gas Emission Factors | Intended for use at the national level and may be applicable at the corporate or project level. | Indirect EFs: • Production fuel mix EFs***** (for some countries includes T&D line loss factors) • Residual fuel mix factors****** • Electricity consumption regional EFs for the United States, Canada, and Australia | • Official government publications |
| Asian Development Bank Guidelines for Estimating Greenhouse Gas Emissions of Asian Development Bank Projects | Intended for use at the project level. | Direct EFs: • Fuel combustion Indirect EFs: • National grid average marginal (avoided) EFs for wind or solar projects and for other projects in 29 countries in Asia | • CDM methodologies • Japan Bank for International Cooperation (JBIC) J-MRV guidelines |
| * Users are advised that some tools are more than 20 years old and may not be applicable to current conditions. ** The AP-42 emissions factors were developed for regulatory use in the USA to evaluate specific facilities/sites but may have greater relevance to facilities or activities occurring outside the USA if processes are the same. *** GHGMI published a blog on the 2021 eGRID tool update that describes the eGrid tool in detail. **** Note that TCR's database for purchased electricity outside of North America is no longer updated – EFs provided are from 2010 and 2011. ***** Used for location-based reporting. ****** Used for market-based reporting. |
|||
In conclusion, while EFs vary in numerous ways the resources presented in this post exist to help you select the most appropriate one.
Additional Resources
Further resources that are publicly available are provided below:
- List of LCA databases collated by the GHG Protocol: https://ghgprotocol.org/life-cycle-databases
- Electric companies may be interested to review the EPRI Greenhouse Gas Emissions Accounting for Electric Companies: A Compendium of Technical Briefing Papers and Frequently Asked Questions – for additional information relating to emission factors and GHG accounting concepts.
- European Union’s European Environment Agency (EEA) Interactive Data Viewer: provides national GHG information for EU-member countries overall and by sector, including electricity emissions.
- European Residual Mix which identifies the make-up of grid-supplied electricity for EU-member states and providing grid emission factors.
- Canada’s National Pollutant Release Inventory: the Canadian national pollutant database for tracking facilities’ pollution released into the air, water, or land.
- Thailand’s CO2 Emissions by Energy Type and Sector: an online platform providing Thailand’s national-level emissions data including data for power generation.
- New Zealand’s guidance for measuring emissions: an emission factor database provided to entities within New Zealand seeking to voluntarily monitor and report GHG emissions.
EF databases and LCA resources that are available behind a paywall (meaning you must pay to access them):
- International Energy Agency (IEA) compiles annual emission factors for world countries from electricity and heat generation here: https://www.iea.org/data-and-statistics/data-product/emissions-factors-2021#emissions-factors
- 2.-0 LCA Consultants – Life cycle assessment and input-output databases (i.e., databases based on national economic and environmental statistics that cover the complete economy) https://lca-net.com/services-and-solutions/life-cycle-inventory-databases/
This blog post draws from content published by the Electric Power Research Institute (EPRI): EPRI Greenhouse Gas Emissions Accounting for Electric Companies: A Compendium of Technical Briefing Papers and Frequently Asked Questions which was authored by GHGMI.
Cover image is within the public domain.
Footnotes:
[1] https://www.epa.gov/air-emissions-factors-and-quantification/basic-information-air-emissions-factors-and-quantification [2] This is a simplified example, but typically when it comes to fuel combustion an EF would express CO2 by the energy content of fuel (as opposed to the mass of fuel) so CO2 per MJ or TJ of fuel combusted would be more common. [3] Technical note: this is the definition of an indirect EF according to the GHG Protocol, however the IPCC Guidelines identify indirect emissions in Chapter 7 of the 2019 Refinement to the 2006 IPCC Guidelines to be emissions that are caused as a result of non-anthropogenic processes. Within organizational accounting (what the GHG Protocol established) if there is no other entity responsible for the emissions entering the atmosphere then the entity that caused the non-anthropogenic processes, which led to GHG emissions, would be assigned responsibility for the emissions and it would be categorized as a direct emission (“Scope 1”). For example, when nitrogen fertilizer is applied to an agricultural field it leaches into the ground and surface water causing N2O emissions “downstream” of the fertilizer’s application – this occurs through the non-human induced process of microbial denitrification (as well as other processes not described). The GHG Protocol would characterize the application of fertilizer as a direct or “Scope 1” emission source while the IPCC Guidelines would identify it as an indirect emission because the act of applying fertilizer to an agricultural field does not directly result in emissions, rather it is the downstream microbial denitrification that causes atmospheric levels of GHGs to increase. This is an example of why different GHG accounting frameworks – organizational and national in this instance – are distinct tools that produce non-comparable results. [4] I recently learned from Matej Gasperic, Senior Program Manager at GHGMI, that measuring the mass flow of a waste gas stream from a stack can have an uncertainty of 5-12%. This results from uncertainty in the measurement of the concentration of CO2, the velocity, the moisture content, the temperature, and the chimney dimensions and shape. [5] Essentially the number of Carbon (C)-atoms in the fuel equals the CO2 molecules emitted because the fuel is the source of C-atoms. [6] For example, unlike CO2, N2O forms from the nitrogen present in the air, but only a portion of the available nitrogen becomes N2O. For CH4 emissions, the burn efficiency for natural gas determines whether some molecules of CH4 enter the atmosphere but the burn efficiency is dependent upon the technology, its calibration, temperature, the level of activity (e.g., is the engine being run at maximum or optimal output) and other potentially variable factors. [7] 2006 IPCC Guidelines Chapter 2. Available: https://www.ipcc-nggip.iges.or.jp/public/2006gl/vol1.html
Comments